PythonTutor's Visualisation Tool: The Easy Way to Debug Your Code

An Electrical Engineer who is enthusiastic about coding , currently working with Qt and taking up these challenges in twitter to build connstructive habits.
#100DaysOfCode
#100DaysOfWriting
#100DaysOfReading
#100DaysOfMeditation
🐞Introduction
Debugging is the process of identifying and correcting errors or bugs in a computer program. It is an essential part of programming that allows developers to find and fix issues that would otherwise prevent their code from working correctly. Debugging is crucial because it helps programmers identify and fix errors, which can save time and prevent costly mistakes.
Python is one of the most popular programming languages used today, and its popularity can be attributed to its simplicity and ease of use. However, like any other programming language, Python can also be challenging to debug. This is where PythonTutor's visualization tool comes in handy.
PythonTutor's visualization tool is an easy-to-use debugging tool that allows developers to visualize their code as it runs. This tool can be used for visualizing code in Python, Javascript, C, C++, and Java. This tool is particularly useful for beginners who are just learning to code or for developers who are working on complex projects. With PythonTutor's visualization tool, developers can easily identify and fix errors in their code, making the debugging process much more efficient.
In this article, we will take a closer look at PythonTutor's visualization tool and how it can be used to debug Python code. We will explore the key features of the tool, how it works, and provide some examples of how it can be used in practice. Whether you are a beginner or an experienced developer, this article will provide you with valuable insights into how to make the most of PythonTutor's visualization tool.
🐞Features of Visualization Tool
Programming relies heavily on precision and predictability, and a programmer must have a clear understanding of the values generated by their code during execution. If the values stored in variables don't match the expected values, there's likely a bug in the program.
Both debugging print statements and visualization tools are effective means for a programmer to visually confirm that a program is functioning as intended. These techniques enable a programmer to see for themselves that the program is operating according to their expectations.
Presenting the screenshot of the program for finding the nearest leap year from a given year as inputted by the user.
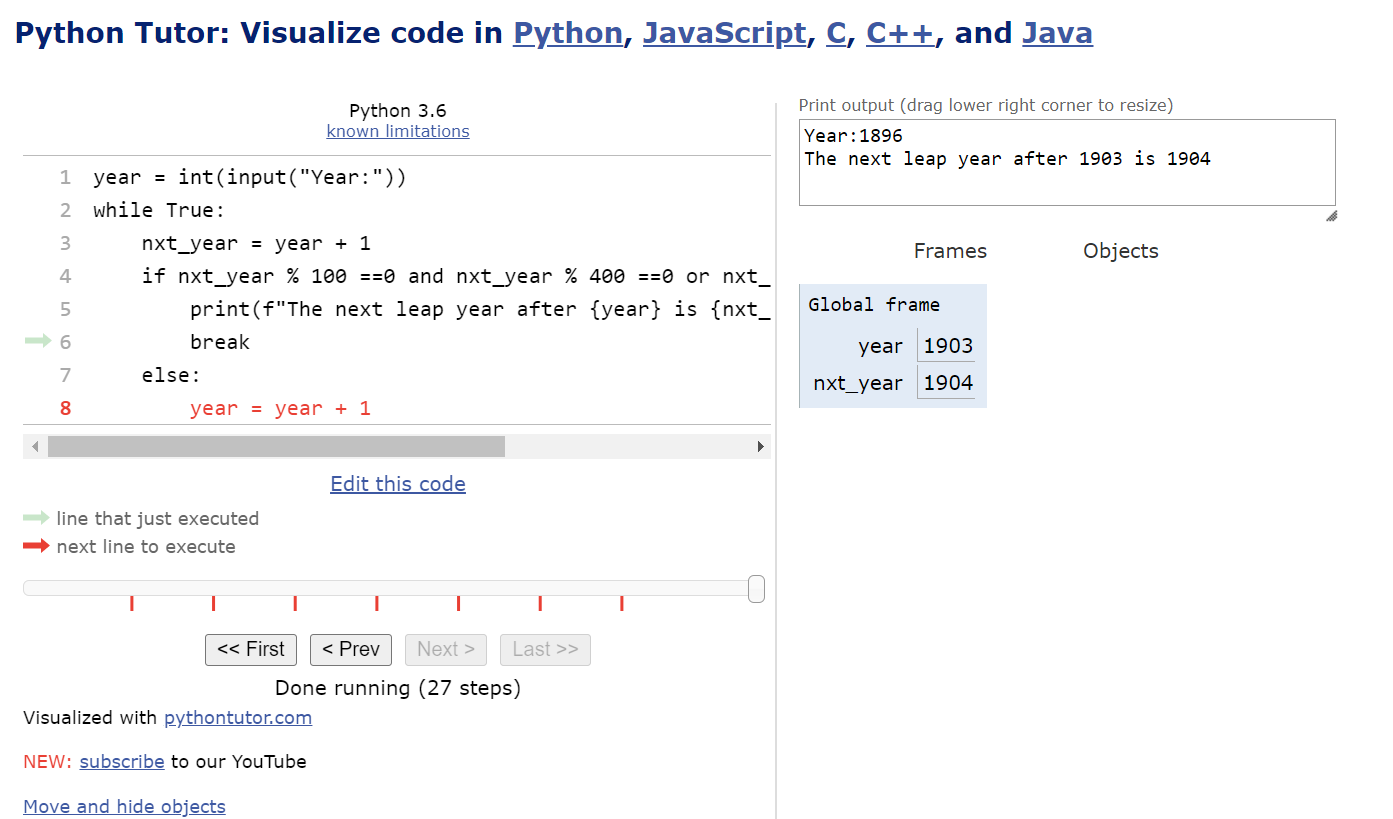
Code Editor: It is the big block on the left where you can simply copy and paste the code which you want to test.
Arrows: The green arrow shows that the line has just been executed whereas the red arrow shows the next line to get executed.
Progress bar: It is the line at the bottom showing the progress of the execution in terms of steps. There are options like first, previous, next, and last given to help one navigate to any intermediate steps between the start to end during execution. Alternatively, there's a knob of the progress bar which can be dragged by the user to show the changes taking place at each step. In the screenshot, one can see that there are 27 steps in this code and currently all steps have been executed.
Output box: It is the box on the top right side of the screen that shows the value as output as entered by the user.
Workspace: This contains frames and objects. In the frame, it shows the instantaneous values of the variables present in the frame (scope).
🐞Using Visualization Tool for debugging
After being acquainted with the interface of the visualization tool, let's dive deeper into the section on using this tool to debug the code. For debugging, I will be taking the same problem as described in the previous section, i.e. finding the nearest leap year from a given year as inputted by the user.
This problem has been picked up from Python Programming MOOC 2023 - Part2 - Simple Loop -Exercise 6. I wrote the following code.
year = int(input("Year:"))
while True:
    nxt_year = year + 1
    if nxt_year % 100 ==0 and nxt_year % 400 ==0 or nxt_year% 4 ==0 and nxt_year%100!=0 :
        print(f"The next leap year after {year} is {nxt_year}")
        break

    else:
        year = year + 1
This program is expected to produce the following output for input - 1896
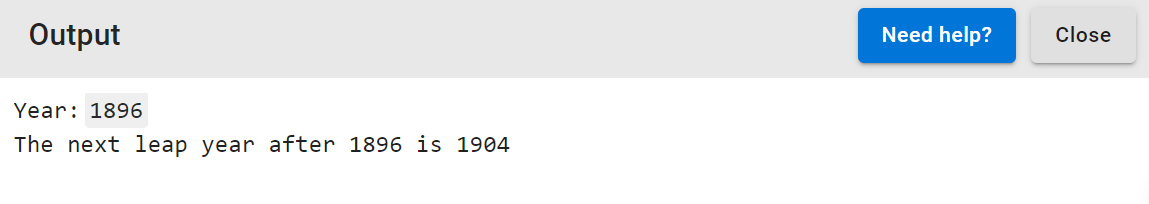
but it produces the following output:
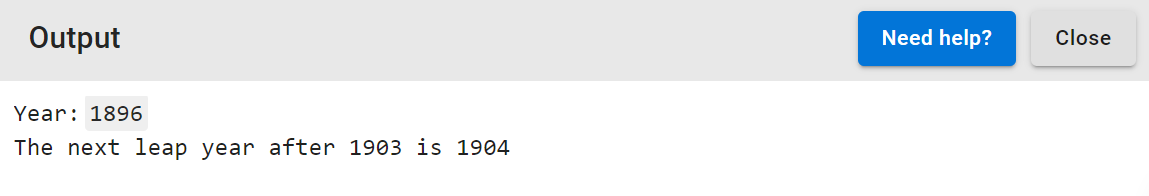
Let's investigate the value of variables through Visualization Tool
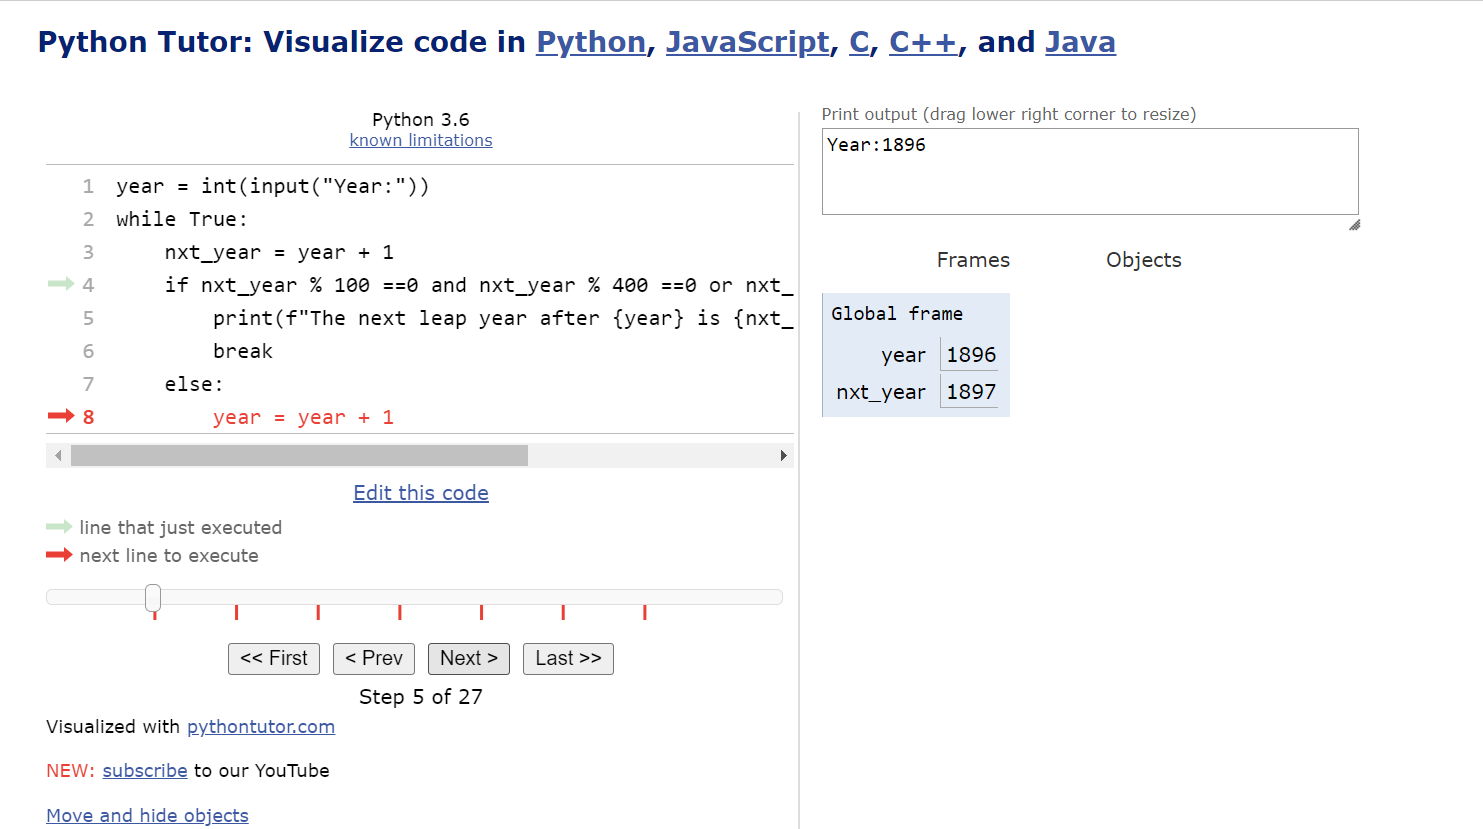
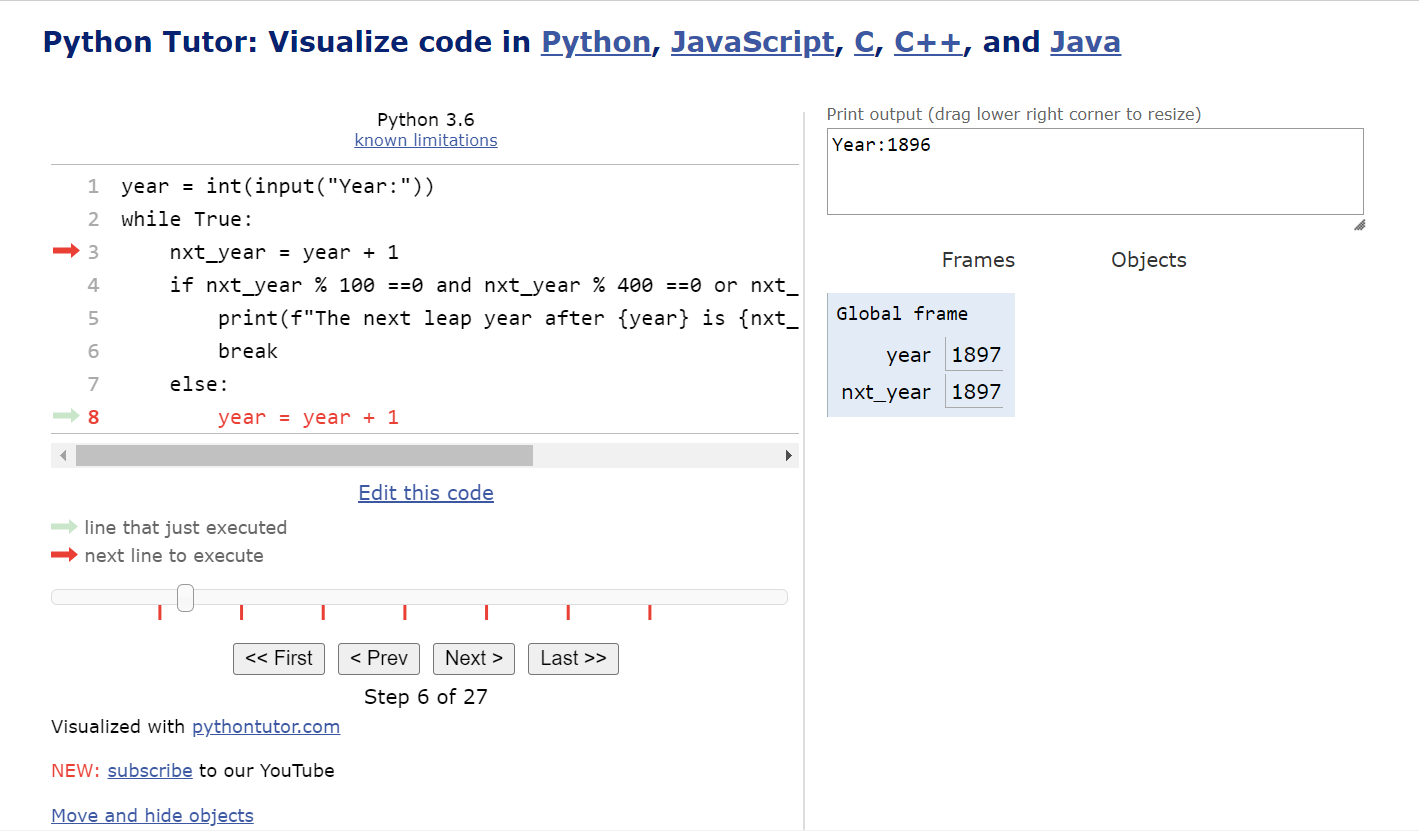
Step 5: The control enters the loop; the value of variables in the first iteration of the while loop ; increments nxt_year by one and applies the condition of leap year. If the condition is satisfied, it prints the next message else it increments the year by 1.
This format of the while loop is like a do-while loop of C++ where the first operation is done by default without the application of the condition.
year = 1896 , nxt_year = 1897
Step 6:
Since the if-condition fails, year now gets incremented by 1 and the next iteration increments nxt_year.
year = 1897 , nxt_year = 1897
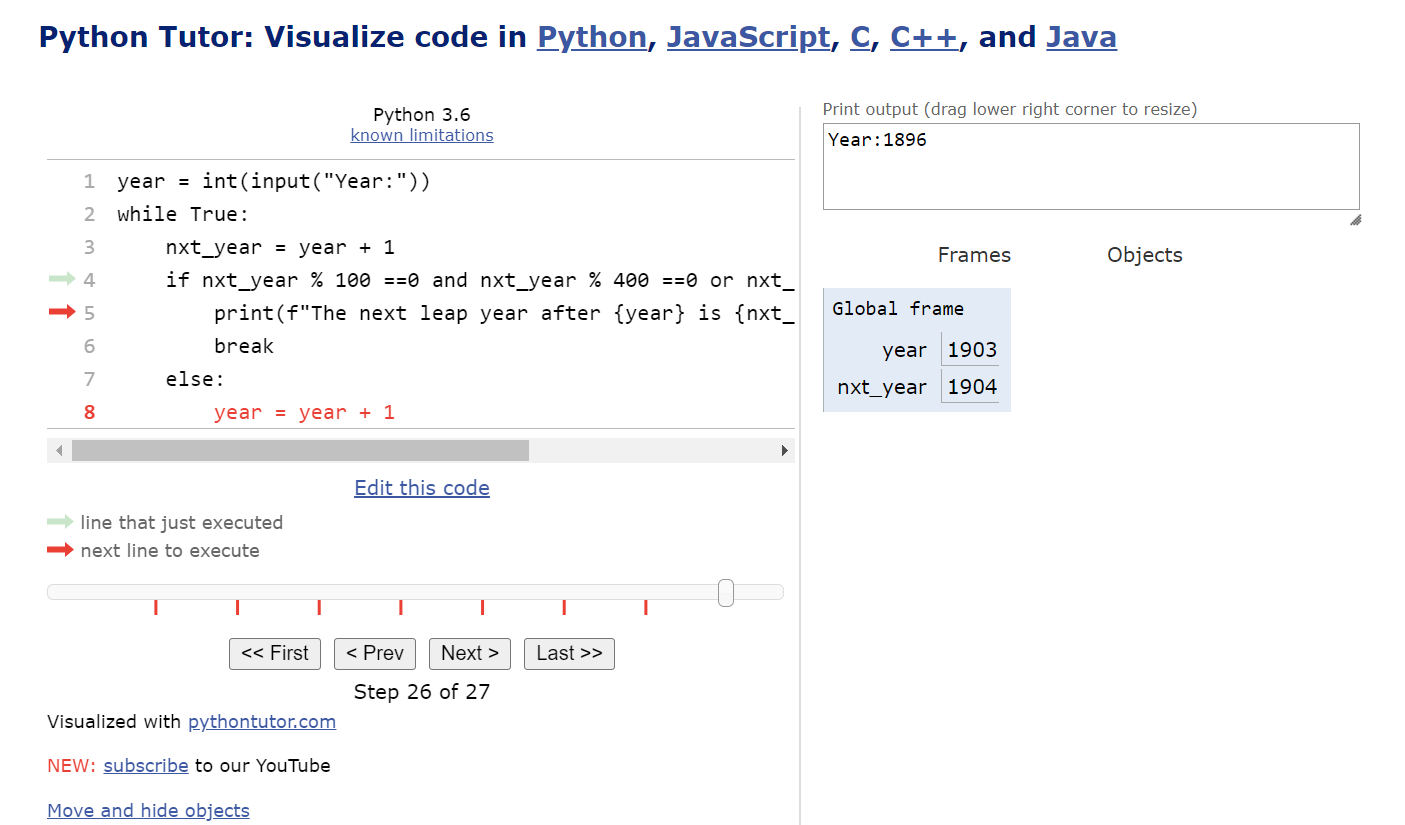
step 26:
if-condition fails till the 26th steps and the values of year and nxt_year increment by 1 in each step.
year = 1903 , nxt_year = 1904
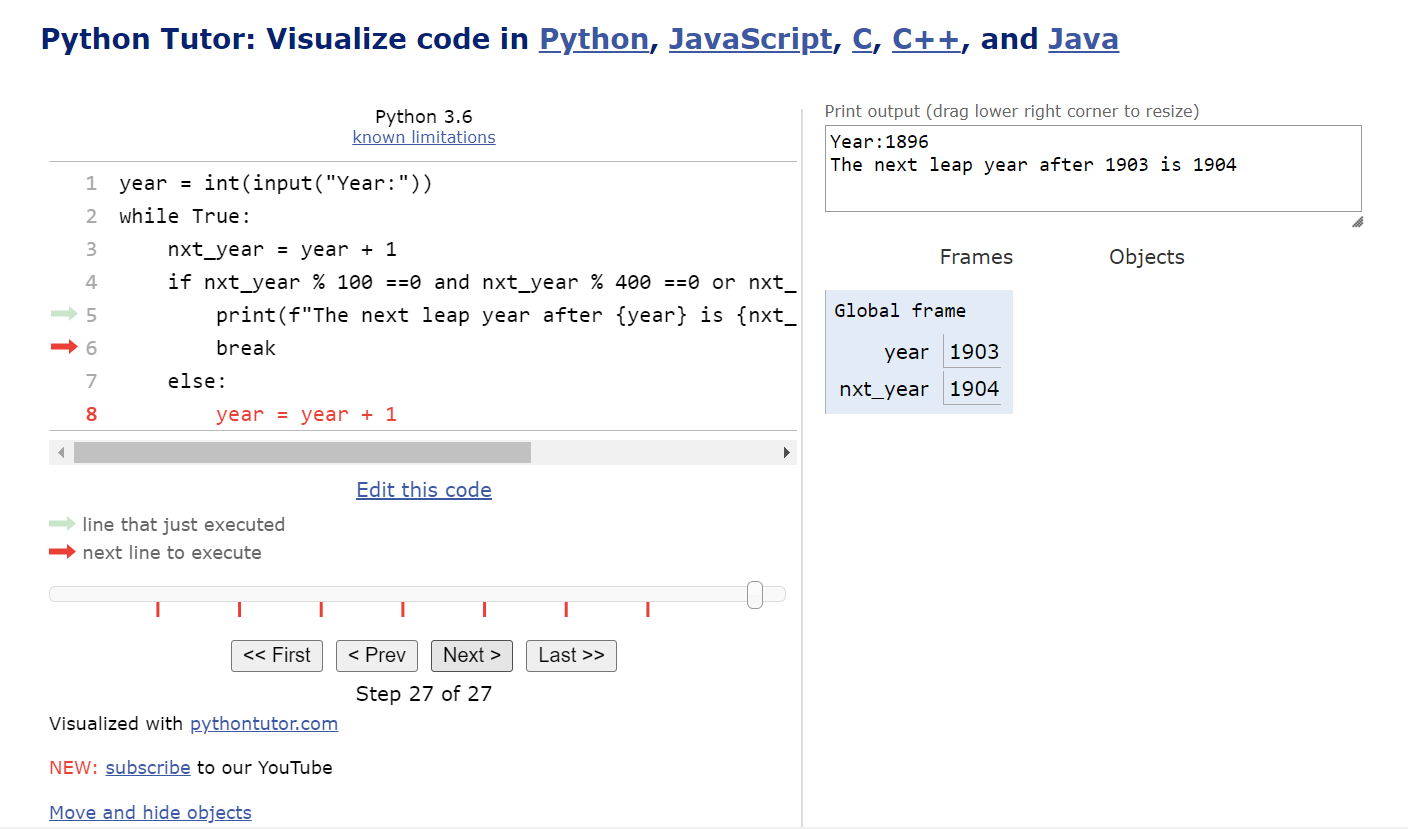
step 26:
It is the step when nxt_year = 1904 which satisfies the if-condition, so the print statement is executed as you can see in the second statement in the output box on the top right section of the following screenshot.
The expected output should display the inputted year in form of "The next leap year after {input year} is {leap year}". The inputted variable for the year is year and it keeps getting incremented in each iteration. This increment is necessary so as to navigate through the next years for applying the condition of leap year.
The solution is to store the value of the original inputted year in a variable as a copy to prevent it from getting incremented as use this copy in printing the final output.
I created a variable; year_orig
year_orig = year
and use it for printing the output message as
print(f"The next leap year after {year_orig} is {nxt_year}")
Corrected code:
year = int(input("Year:"))
year_orig = year
while True:
    nxt_year = year + 1
    if nxt_year % 100 ==0 and nxt_year % 400 ==0 or nxt_year% 4 ==0 and nxt_year%100!=0 :
        print(f"The next leap year after {year_orig} is {nxt_year}")
        break
    else:
        year = year + 1
This produces the following output :
🐞Limitation of Visualization Tool
Although the visualization tool can be useful for beginners, it has some limitations compared to other Python versions. Therefore, if you encounter confusing error messages, you may need to use alternative debugging methods. Experienced programmers usually rely less on the visualization tool but for beginners, it is a very useful tool to understand the flow of execution.
🐞Conclusion
In the nutshell, PythonTutor's visualization tool is an easy-to-use debugging tool that allows developers to visualize their code as it runs. The key features of this tool include real-time code execution, step-by-step execution, visualization of code execution, and multiple language support. The tool works by providing an overview of the code's architecture, executing and visualizing the code, and supporting various platforms and environments.
In practice, PythonTutor's visualization tool can be used to debug simple and complex Python programs, identify errors, and optimize performance. Using the tool, developers can improve their code comprehension, enhance the learning experience for beginners, and debug their code faster and more efficiently.
So, what are you waiting for? Start exploring Visualization tool to debug your code.


